
Validation
Validation: Natural Convection
This validation case tests the Vanellus convective heat transfer solver in a differentially heated cavity. We compare the results with measurements from Betts & Bokhari (data available here), a SimScale OpenFOAM study, and results from Zhang et al. using Ansys Fluent.
The setup
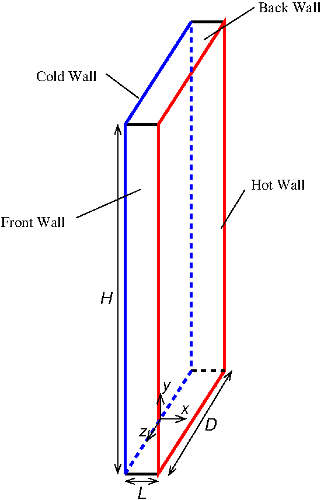
This benchmark is a prototypical case of natural convection. A tall rectangular cavity (pictured below) is differentially heated on its two largest faces, with a temperature difference of 19.6°C. The remaining walls are insulated. This difference drives a quasi-2D circulation inside the cavity, with fully turbulent flow at its core.
Results
The experimentalists used temperature probes and laser particle-tracking to measure the temperature and vertical velocity along the centerline of the box (\(y=0\) in the above diagram).
We ran a steady-state convective heat transfer analysis using the \(k\)-\(\omega\) SST turbulence model. We discretized the domains using our rectilinear mesher, with fixed-temperature hot and cold walls. We used the SIMPLE algorithm to iterate toward steady state and stopped iterating once the temperature profile across the box had stabilised.
We compared our results to the experimental values in Betts & Bokhari, a case study of the same problem conducted by SimScale, and an equivalent \(k\)-\(\omega\) SST simulation performed in Ansys Fluent by Zhang et al.. Both the SimScale and Ansys Fluent studies use unstructured meshes, in contrast to our rectilinear mesh, but all three model the same physical problem.
In the plots below we compare the temperature and vertical velocity profiles at various heights within height of the rectangular cavity.
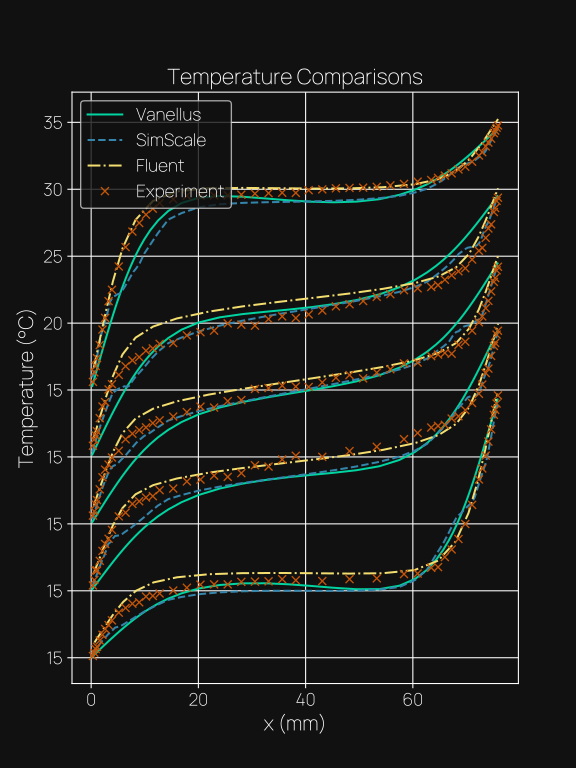
As expected, the temperature profile rises from 15°C at the cold wall on the left to 34.6°C at the hot wall on the right. In the center of the cavity the shear flow generates a turbulent region where the temperature gradient is lower than it is near the walls.
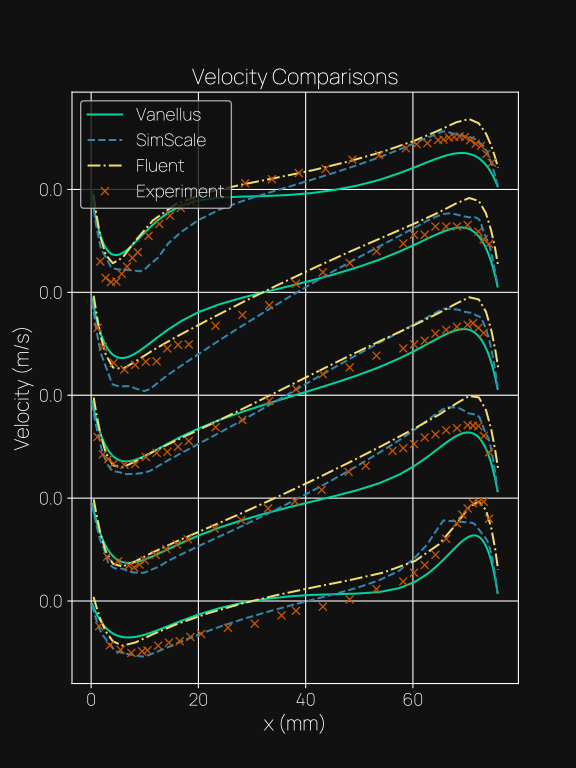
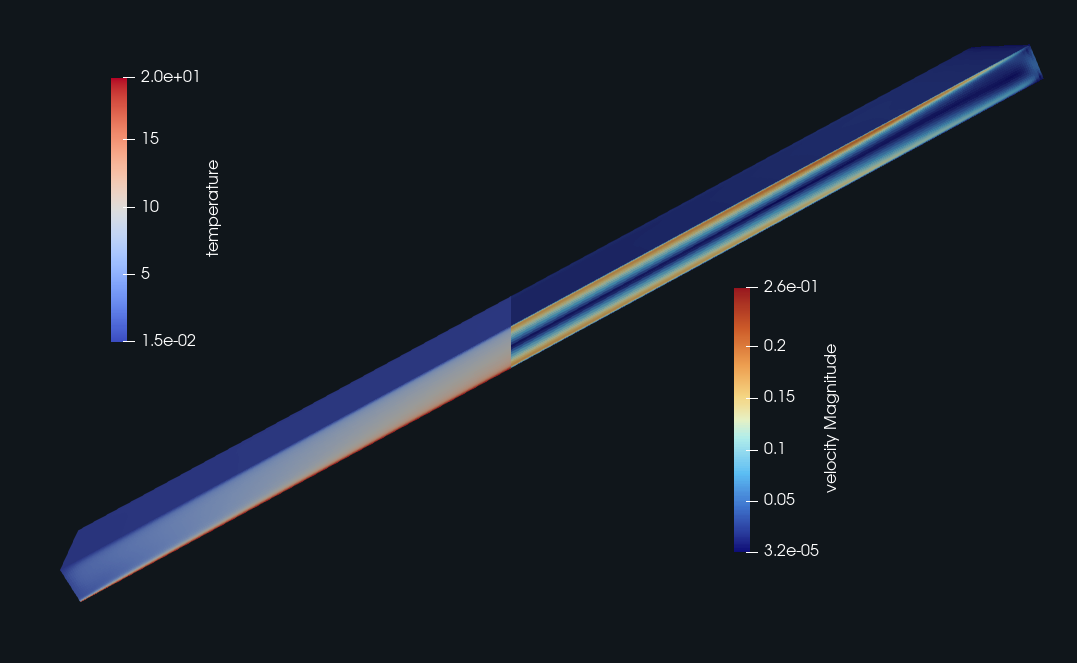
The velocity profiles show the circulation cell developing: cold air descends on the left and hot air rises on the right. The flow-field visualization below shows the same pattern.
The graphs show that Vanellus, SimScale, and Ansys Fluent achieve similar agreement with the experimental data. No single solver matches the data perfectly, and each one agrees better in some regions than in others.
Solver performance
For this benchmark, we used our in-house automated rectilinear meshing pipeline to generate a finer mesh near the heated walls where the air moves fastest as it circulates around the cavity.
Although the unstructured SimScale mesh uses fewer cells (around 3.1M vs 3.8M for our rectilinear mesh), our GPU-accelerated solver completes the case in 4 minutes on an NVIDIA RTX Pro 6000 Blackwell GPU, versus 128 minutes (or 70 core-hours) for SimScale's CPU-bound solver. The Ansys Fluent study did not report a runtime.
Conclusion
This benchmark demonstrates close agreement with experimental measurements and results from established CFD tools for a turbulent natural-convection case. On the reported runs, Vanellus completed a larger mesh 32 times faster than the SimScale comparison.
References
- Betts, P.L. & Bokhari, I.H. "Experiments on turbulent natural convection in an enclosed tall cavity", Int. J. Heat & Fluid Flow 2000, Vol 21, pp 675-683. https://doi.org/10.1016/S0142-727X(00)00033-3
- SimScale, "Natural Convection: Buoyant Flow Between Heated Plates", https://www.simscale.com/docs/validation-cases/buoyant-flow-natural-convection-between-heated-plates/
- Zhang, Z., Zhang, W., Zhai, Z. J., & Chen, Q. Y. "Evaluation of Various Turbulence Models in Predicting Airflow and Turbulence in Enclosed Environments by CFD: Part 2—Comparison with Experimental Data from Literature", HVAC&R Research 2007, 13(6), 871–886. https://doi.org/10.1080/10789669.2007.10391460